On-chain Data Academy (Part Seven): A Brand New, Ark-involved $BTC Magical Pricing Methodology (II)

Original Article Title: "On-Chain Data Classroom (VII): A Brand New Set, Ark Participated Research on the Magical Pricing Methodology of $BTC (II)"
Original Article Author: Mr. Berg, On-Chain Data Analyst
If you are not familiar with Cointime Price yet, it is recommended to read the first article: "On-Chain Data Classroom (VI): A Brand New Set, Ark Participated Research on BTC's Magical Pricing Methodology (I)"
TLDR
- The Cointime Price series consists of three articles, this being the second article
- This article will introduce the application method of Cointime Price in top avoidance
- This article will introduce a personally designed deviation model
1. Brief Review of Cointime Price
The concept of Cointime Price originates from Cointime Economics, which evaluates BTC's fair price in a "time-weighted" manner.
Compared to simply Long-Term Holders (LTH) and Short-Term Holders (STH), Cointime Price is more elastic, sensitive, and can effectively exclude the influence of ancient lost BTC.
The first article detailed Cointime Price and its buy-the-dip application. If you already understand the concept, let's officially delve into today's topic: top avoidance application
2. Top Avoidance Application Methodology: Cointime Price Deviation Model Design
Cointime Price Deviation is one of the models I designed during my on-chain data research and has been applied in the weekly top avoidance analysis report.
Related Tweet: [Top Avoidance Model Introduction](https://x.com/market_beggar/status/1870763628645032213)
The following text will explain the model's design principles and how to use the model to assess BTC tops. All content in this article is original research, the research process is not easy, so please show your support
1. Quantifying Current Price Deviation from Cointime Price
Why Measure Deviation?
- The Cointime Price highly represents the true holding cost of BTC chips, especially for Long-Term Holders (LTH).
- Since Long-Term Holders have a greater impact on the Cointime Price, when the BTC current price is significantly higher than the Cointime Price, the profit-taking motivation of Long-Term Holders increases, which may trigger distribution behavior.
· Calculation Formula: Deviation Rate = (Current Price - Cointime Price) / Current Price
· Observing Deviation Rate (Distribution Rate)
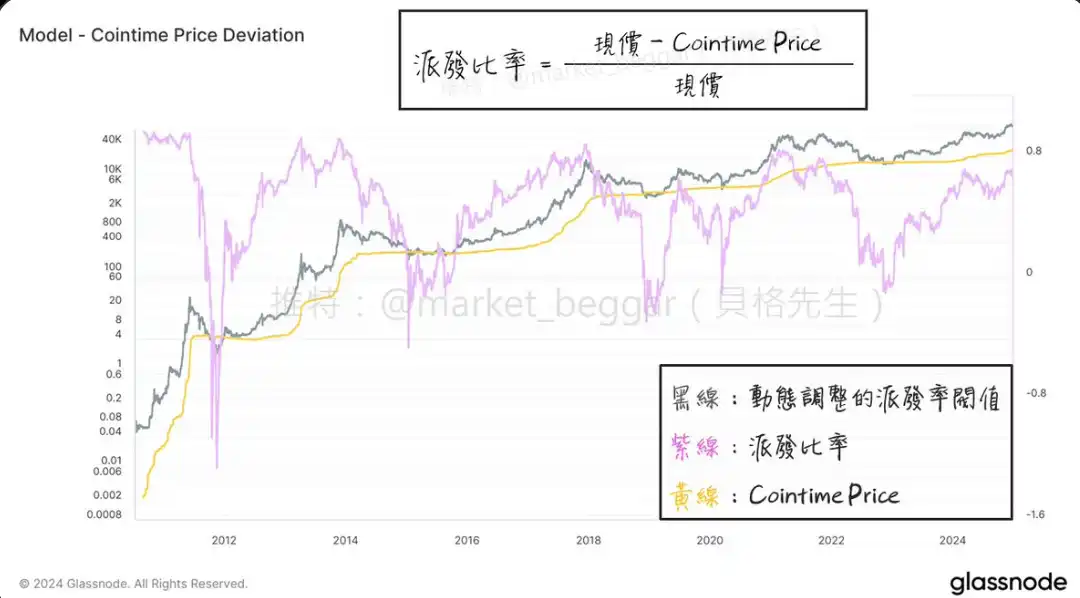
As shown in the chart, we can obtain the Distribution Rate curve (purple line). We can see that: whenever the Distribution Rate is at a high level, it often corresponds to the BTC top.
So, how do we define a "high level"? Next, we will use statistical methods to address this issue.
2. Cointime Price Deviation Extreme Value Definition
If we observe historical data, we will find that the high points of Deviation are not fixed; in each bull market cycle, the peak value of Deviation slightly decreases. Therefore, it is not rigorous to solely use a fixed numerical value to define a "high level."
To address this, I adopt the concept of statistical "standard deviation":
· Calculate the mean and standard deviation of historical Deviation data.
· Define "Mean + n standard deviations" as the "high level (top signal)," referred to as the Threshold.
· Smooth the Deviation data with a moving average to reduce noise.
· When the moving average value of Deviation> Threshold, trigger a top signal.
· Why Use Standard Deviation?
· The historical trend of Deviation exhibits mean reversion characteristics (as shown in the chart).
· Standard deviation measures volatility, so when BTC price volatility decreases, the Threshold will also dynamically adjust, providing more elasticity.

As shown in the above diagram, after the above processing, we can get such a diagram.
· Supplementary Explanation
- In point 2, "Mean + n Standard Deviations," n is an adjustable parameter: the larger n is, the lower the probability of vertex signal occurrence, and the model is more stringent.
- Point 3's moving average smoothing: mainly filters out short-term market fluctuations to improve signal reliability.

3. Top Escaping Signal Example
As shown in the figure, when the purple line (Distribution Ratio) exceeds the orange line (Threshold), the corresponding BTC price is often at a phase top.
III. Conclusion
This article is the second in the Cointime Price series, continuing the concepts of the previous article, sharing how individuals can design a top escaping model using Cointime Price.
· Summarize Core Points:
- Cointime Price Deviation quantifies the deviation of the current BTC price from the Cointime Price, speculating on the distribution motivation of long-term holders, used to determine the BTC top.
- The "Standard Deviation" method is used to dynamically define top signals to ensure the model is more adaptive.
- The model has been practically applied in weekly reports and can effectively capture BTC high-level signals.
Future Plans:
- The third article in this series will continue to explore the application of Cointime Price in escaping the top, so stay tuned.
You may also like

The AI gamble of mining companies: Valuations enter a phase of differentiation, and it's hard to turn the tide

A letter from Alliance to entrepreneurs: Written on the occasion of Cursor selling for 60 billion dollars

Will MicroStrategy fall into a death spiral? What will the macro trend be in the second half of the year?

Blockchain Capital Partner: The Core Secret of Arbitrage

STRC unanchored by 11%, can the perpetual motion machine of Strategy still operate?

Bitcoin Market Analysis 2026: Can BTC Reach $150K by Year-End?

Bitcoin ETF Outflows Hit a Record $4.4 Billion: What Are Traders Doing With Their Cash?

WEEX App Just Got Smarter – New Tabs for Faster Trades & Easy Asset Management

WEEX All-New Search Features: Find, Trade & Earn Faster Than Ever

Morning Report | Illinois signs the strictest digital asset tax law in the U.S.; RWA tokenization market size surpasses $43 billion, institutions accelerate the migration of on-chain assets

Full version of the debut Q&A! Federal Reserve Chairman Waller: Sticking to the 2% inflation target, establishing five special working groups, individual did not submit the dot plot

From Disruptor to Shadow Market: The Crypto Market is Becoming a Colony of Traditional Finance
Dalio's important long article: How to position in the current market environment?
OKX Star analyzes Binance's competitive advantages: when regulation levels the playing field, competition has just begun

New gameplay for participating in initial offerings on cryptocurrency exchanges
Why Is Bitcoin Down Today? What the Hawkish FOMC Means for SpaceX, Gold and Nasdaq

DeepSeek Financing Story

