On-Chain Data School (Part 2): The Evergreen Profitable Hodlers, What Was Their Cost Basis for Buying BTC?


Original Article Title: "On-chain Data School (Part 2): The Evergreen Hodlers, What Is Their $BTC Acquisition Cost?"
Original Article Author: Mr. Berg, On-chain Data Analyst
TLDR
- This article will continue the concept of MVRV from the previous part, introducing LTH-MVRV
- LTH = Long Term Holder, defined as BTC held for over 155 days
- LTH-MVRV represents the profitability status of long term holders
- LTH-RP represents the average cost of long term holders
Let's now dive into the main content!
What Is LTH?
LTH = Long Term Holder, defined by Glassnode as "BTC held for over 155 days".
As for why it is 155 days, Glassnode has provided a detailed explanation on their official website; due to the complexity of the content, I will not delve into it here, but interested readers can explore it on their own.
Introduction to LTH-RP
LTH-RP, which stands for Long Term Holder's Realized Price, is essentially their average holding cost. The algorithm divides LTH-Realized Cap by the circulating supply.
As shown in the graph below, the light green color represents the overall market's Realized Price, while the dark green color represents the LTH's Realized Price. The holding cost of long term holders is usually lower than the overall market's average cost.
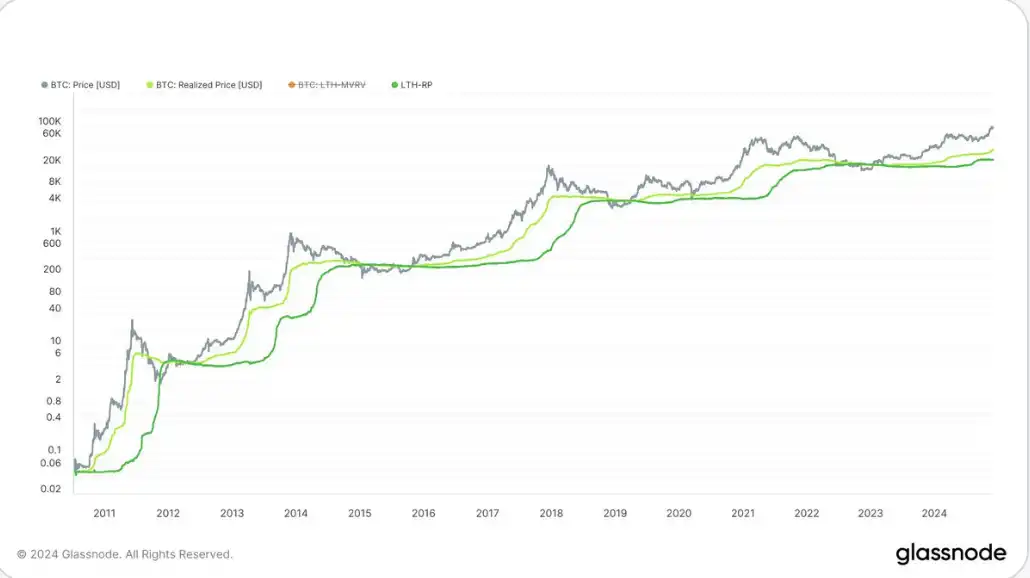
Comparison of Realized Price and LTH-RP
Introduction to LTH-MVRV
Representing the profit situation of long-term holders, similar to the calculation of MVRV, the LTH-MVRV algorithm is "current market value / LTH-Realized Cap," which can also be expressed as "current market price / LTH-Realized Price."
As shown in the chart below, the change in LTH-MVRV is usually more pronounced than MVRV, because the profits of long-term holders are usually substantial.
Comparison ofMVRV and LTH-MVRV, where the orange line represents LTH-MVRV and the yellow line represents MVRV
Application of Bottom Fishing for LTH-MVRV
When LTH-MVRV < 1 (or in other words, when the market price is below LTH-RP), it means that even the average long-term holder is at a loss, usually indicating a good bottom fishing opportunity.
As shown in the chart below, I have marked the times when LTH-MVRV < 1, which mostly correspond to cyclical major bottoms. When designing a bottom fishing strategy, this indicator can be taken into consideration~

Prices corresponding to LTH-MVRV < 1
Conclusion
Above is all the content of On-Chain Data Academy (Part Two). Readers interested in delving deeper into on-chain data analysis, be sure to follow this article series!
If you want to see more analysis and educational content on on-chain data, feel free to follow my Twitter (X) account!
Hope this article has been helpful to you. Thank you for reading.
You may also like

New gameplay for participating in initial offerings on cryptocurrency exchanges

Why Is Bitcoin Down Today? What the Hawkish FOMC Means for SpaceX, Gold and Nasdaq

OKX Star analyzes Binance's competitive advantages: when regulation levels the playing field, competition has just begun

Full version of the debut Q&A! Federal Reserve Chairman Waller: Sticking to the 2% inflation target, establishing five special working groups, individual did not submit the dot plot

From Disruptor to Shadow Market: The Crypto Market is Becoming a Colony of Traditional Finance

Dalio's important long article: How to position in the current market environment?

DeepSeek Financing Story

Morning Report | Illinois signs the strictest digital asset tax law in the U.S.; RWA tokenization market size surpasses $43 billion, institutions accelerate the migration of on-chain assets
Morning Report | DeepSeek completes over $7 billion in financing, with a valuation exceeding $50 billion; Musk's personal wealth has surpassed the total market value of Bitcoin

Cursor, why did you get on Musk's spaceship?
In the name of charity, for the benefit of the family: How the Trump family turned charity into profit?

Will Gold Break $4,500 After Tonight's Fed Decision? What XAUT and PAXG Traders Need to Know
SharpLink CEO: How to understand that Ethereum developers have just surpassed 1 million?

Morning Report | MiCA grace period expires on July 1; Kalshi's trading volume in the first week of the World Cup breaks $5.1 billion, setting a record

The foundation of SpaceX's trillion-dollar valuation: Who is dividing Musk's annual capital expenditure of tens of billions?
How to exit after asset tokenization?
The stablecoin positioning battle escalates: When compliance is just a ticket to entry, will USD1 become the biggest winner?

