Stablecoin Market Cap Surges Past $235 Billion, While Meme Coins Stay Flat – Where Is the Money Hiding?


Original Article Title: "A Comprehensive Analysis of the Fund Flow Behind the $100 Billion Growth of Stablecoins, Shitcoins Stayed Flat, Where Did the Money Go?"
Original Article Author: Frank, PANews
Since 2024, the global stablecoin market has grown by 80.7% to surpass $235 billion, with USDT and USDC leading the market with a contribution rate of 86% growth. However, it is puzzling that the incremental billions of dollars deposited on the Ethereum and Tron blockchains did not trigger a simultaneous surge in the shitcoin market as in previous cycles. Data shows that for every additional $1 of stablecoin, only $1.5 of shitcoin market cap growth was leveraged in this cycle, an 82% decrease from the previous bull market.
This article will conduct a comprehensive data analysis of stablecoins to interpret the ultimate question brought by stablecoin growth in the crypto space: where did the money go? As exchange balances surge and DeFi protocol TVL rises, the penetration of OTC trading by traditional financial institutions, cross-border payment scenarios, and the currency substitution demand in emerging markets are quietly reshaping the fund flow map of the crypto world.
Stablecoin Market Cap Increases by $100 Billion, Ethereum and Tron Still Contribute 80% of Growth
According to defillama's data, from 2024 to the present, the issuance of stablecoins has increased from $130 billion to $235 billion, representing an overall growth of 80.7%. The primary growth still comes from the two major stablecoins, USDT and USDC.
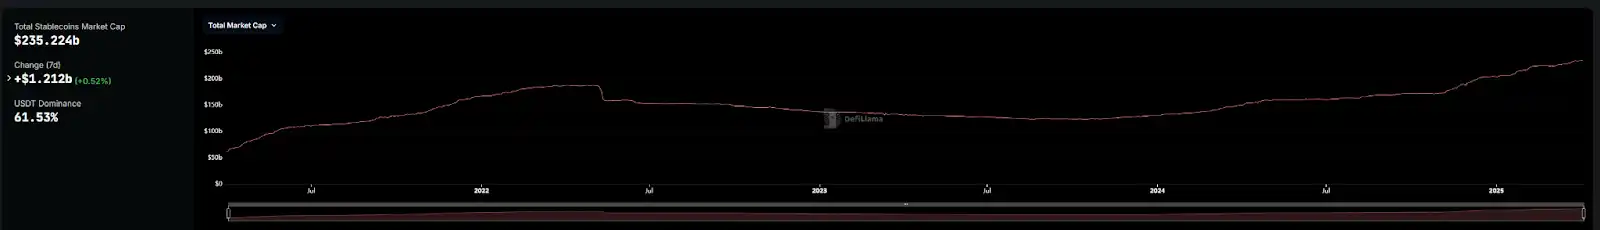
On January 1, 2024, the supply of USDT was $91 billion. By March 31, 2025, the supply had increased to $146 billion, with an increase of approximately $53.6 billion, contributing 51% to the growth rate. Over the same period, USDC's supply increased from $23.8 billion to $60.6 billion, accounting for a growth rate of about 35%. These two stablecoins not only hold an 87% market share but also contribute 86% to the growth.
A closer look at the on-chain data reveals that Ethereum and Tron remain the two blockchains with the largest supply of stablecoins. Ethereum accounts for 53.62% of the stablecoin supply, while Tron's share is approximately 28.37%, totaling 81.99%.
In particular, Ethereum's stablecoin supply increased by approximately $58 billion from January 1, 2024, to April 3, 2025, with a growth rate of 86%, closely mirroring the issuance growth rates of USDT and USDC. Tron's growth rate is about 34%, lagging behind the overall stablecoin growth rate.

The third-ranked public chain is Solana, with a simultaneous increase of 12.5 billion US dollars in circulation, achieving a growth rate of 584.34%. The fourth is Base, which increased by 4 billion US dollars in circulation, with a growth rate of 2316.46%.
Among the top ten, Hyperliquid, TON, and Berachain all started issuing stablecoins only in the past year. These three have added approximately 3.8 billion US dollars in stablecoin issuance, contributing 3.6% to the stablecoin growth share. Overall, Ethereum and Tron still dominate the stablecoin market.
Every Additional $1 of Funding Only Boosts the Market Cap of Shitcoins by $1.5
Although stablecoins have experienced rapid on-chain growth, the simultaneous increase in the market cap of shitcoins has not been ideal,
For comparison, in March 2020, the total market cap of shitcoins was about 39.8 billion US dollars (excluding BTC, ETH), and by May 2021, the shitcoin market cap had risen to 813.5 billion US dollars. This represents an increase of approximately 19.43 times. Over the same period, stablecoin data increased from 6.14 billion to 99.2 billion US dollars, roughly a 15-fold increase, which is largely synchronous. The increases are roughly synchronized.
In this current bull market phase, the overall market cap of stablecoins has increased by 80%, but the overall market cap of shitcoins during the same period has only increased by 38.3%, an increase of approximately 159.9 billion US dollars.

Recapping the period from 2020 to 2021, for every additional $1 of stablecoin issuance, the total market cap of shitcoins increased by $8.3. However, by the period of 2024 to 2025, for each additional $1 of stablecoin issuance, the market cap of shitcoins only increased by $1.5. This significant reduction in ratio indicates that the newly issued stablecoins seem to not have been used to purchase shitcoins.
Where did the money go? This is a key question.
Public Chain Landscape Reshuffle: Ethereum and Tron Hold Their Ground, Solana and Base Drive Growth
Intuitively, during this cycle, the MEME frenzy on Solana has consistently led this round of the bull market. However, during the hype surrounding MEME, the basic pairing used was with SOL, and stablecoins did not have much participation space. Furthermore, based on the earlier analysis, stablecoin growth still mainly remains on Ethereum.
Therefore, to discover where the growth of stablecoins has gone, one would likely still need to analyze the trends of Ethereum or major stablecoins such as USDT and USDC.
Before diving into the analysis, it might be helpful to outline a few possible directions, which are also common speculations in the market regarding the future of stablecoins. For example, stablecoins being used more in payment scenarios, staking rewards, value storage, etc.
Let's first look at the stablecoin transaction situation on Ethereum. From the chart below, we can observe that the stablecoin transaction volume fluctuates in a regular pattern resembling a heartbeat. Behind this fluctuation, there may be a hidden pattern of stablecoin usage.

When we shorten the timeframe, we can significantly see that this fluctuation pattern is a 5+2 pattern, meaning 2 days of low activity followed by 5 days of peak activity. Upon observation, we can see that the trough period occurs over the weekends, and the peak period is generally from Monday to Wednesday, gradually decreasing from Thursday to Friday. This clear pattern of volatility seems to at least indicate that the transaction initiators of these stablecoins primarily come from institutions or enterprises, as if the dominant scenario were consumer payments, this kind of volatility would not likely be present.

Additionally, looking at the daily transaction frequency, the highest peak of daily transfers of USDT on Ethereum does not exceed 300,000 times, and usually, the transfer frequency and average amount on weekends are far lower than on weekdays. This further confirms the above inference.
USDT Flowing into Trading Platforms, USDC Deposited in DeFi Protocols
Looking at the distribution of holdings, in the past year, the balance of USDT on trading platforms has seen a significant increase. On January 1, 2024, the platform balance was 15.2 billion USDT, and by April 2, 2025, this number had grown to 40.9 billion USDT, an increase of 25.7 billion USD, representing a growth rate of 169%. This increase is much higher than the overall stablecoin issuance increase of 80.7%, and accounts for 48% of the USDT issuance increase during the same period.

In other words, in a little over a year, approximately half of the new issuance of USDT has flowed into trading platforms.

However, the situation with USDC during the same period is quite different. On January 1, 2024, the platform holdings of USDC were approximately 2.06 billion USDC, and by April 2, 2025, this number had increased to 4.98 billion USDC. Over the same period, the additional issuance of USDC was 36.8 billion USDC, of which only 7.9% flowed into trading platforms. The overall platform balance ratio is also only 8.5%, significantly lagging behind USDT's 28.4%.
The majority of the additional USDT issuance has flowed into exchanges, while the increased trading volume of USDC has not entered exchanges.

So where has the additional flow of USDC gone? This may partly explain where the funds in the market are flowing.
Looking at it from the perspective of holding addresses, the top USDC holding addresses mainly come from DeFi protocols. Taking Ethereum as an example, the largest USDC holding address is that of Sky (MakerDAO), with a holding of 4.8 billion tokens, accounting for approximately 11.9%. In July 2024, the holding quantity at this address was only 20 million tokens, increasing 229 times in less than a year. Sky's USDC is mainly used as collateral for its stablecoins DAI and USDS. The growth of USDC at this address still represents the growth of DeFi protocol TVL and the demand for stablecoins.
AAVE is the fourth largest holding address of USDC on Ethereum. On January 1, 2024, AAVE's USDC holding was about 45 million tokens, and by March 12, 2025, the highest point, the USDC holding at this address had increased to 1.32 billion tokens, a growth of approximately $1.275 billion, accounting for 7.5% of the new issuance of USDC on Ethereum.

From this perspective, the increase in USDC on Ethereum is mainly due to the growth of staking products. At the beginning of 2024, the total TVL of Ethereum was about $29.7 billion, although it has recently experienced a decline, there is still a stock of $49 billion (the TVL reached $76 billion at its peak). Calculating based on $49 billion, the TVL growth on Ethereum can also reach 64.9%, a growth rate significantly higher than that of altcoins last year and close to the overall stablecoin growth rate.
However, in terms of scale, although the TVL on Ethereum has increased by $19.3 billion, there is still a significant gap compared to the $58 billion growth of Ethereum stablecoins. Apart from the portion of new issuance contributed by exchanges, staking protocols have not fully absorbed this increase in stablecoins.
A New Scenario Emerges: Paradigm Shift from Cross-Border Payments to Institutional Trading
In addition to the growth of DeFi driving the demand for stablecoins, use cases such as consumer payments, cross-border remittances, and over-the-counter institutional trading may also be new sources of demand for stablecoin growth.
According to multiple official Circle sources, the use case of stablecoins is gradually emerging in scenarios such as cross-border remittances and consumer payments. A report by Rise shows that approximately 30% of global remittances are settled using stablecoins, with this proportion being particularly significant in Latin America and sub-Saharan Africa. Retail and professional-grade stablecoin transfers in Latin America and sub-Saharan Africa saw a year-on-year growth of over 40% from July 2023 to June 2024.
Another report by Circle reveals that by 2024, the net amount of USDC minted by Zodia Markets under Standard Chartered Bank had reached $4 billion. (Zodia Markets is an institutional digital asset brokerage firm that offers services such as OTC trading and on-chain FX to global clients).

Furthermore, customers of the Latin American retail payment company Lemon hold over $137 million USDC, with the platform's users predominantly using stablecoins for retail payments.
In addition to the increase in demand due to scenario variations, the different ecosystem structures of various chains have also led to varying stablecoin demands. For example, the MEME craze on the Solana blockchain has driven DEX trading demand. According to PANews' incomplete statistics, the TVL volume of the top 100 USDC trading pairs on the Solana blockchain is approximately $2.2 billion. Following the rule that half of this volume is in USDC, the corresponding locked-in capital is about 1.1 billion USDC, representing 8.8% of the total USDC issued on the Solana blockchain.
The Cryptocurrency Market Shifts from a "Speculative Bubble" to a "Financial Product"
After conducting a breakdown analysis of stablecoins, PANews finds it challenging to pinpoint a single factor driving stablecoin growth. Therefore, it is difficult to answer the question of where the money in the market has gone. Looking back, we may arrive at a series of complex conclusions.
1. While the market cap of stablecoins continues to grow, it seems that these funds have not massively flowed into the altcoin market, igniting the start of an altcoin season.
2. From the Ethereum market perspective, a significant portion of the growth of the primary stablecoin USDT has still flowed into trading platforms, but it appears more likely to have been used to purchase BTC (given the altcoin and Ethereum markets and the platforms' financial products. The remaining growth in demand may have been absorbed by DeFi protocols. Overall, the funds flowing into Ethereum seem to prioritize stable returns from staking and borrowing protocols. The attractiveness of the cryptocurrency market to traditional funds may no longer be wild price swings but rather a new type of financial product.
3. The emergence of new scenarios has led to traditional financial institutions such as Standard Chartered Bank entering the crypto market, making them one of the new drivers of stablecoin demand. Additionally, in underdeveloped regions where infrastructure is lacking and the local currency is unstable, the adoption of stablecoins is becoming increasingly common. However, there is still no comprehensive statistical data on this part, and we do not know the specific share.
4. Stablecoins have different narrative needs on different blockchains. For example, Solana's growth demand may come from the trading frenzy sparked by memes. The growth momentum of new public chains like Hyperliquid, Berachain, and TON has also brought about a certain level of capital demand.
Overall, the undercurrents of this capital migration reveal that the crypto market is undergoing a paradigm shift. Stablecoins have surpassed the boundaries of being mere transactional mediums and have become a value conduit connecting the traditional financial world with the crypto space. On the one hand, meme coins have failed to receive a massive transfusion of funds due to the growth of stablecoins. On the other hand, the financial management needs of institutional funds, the essential need for payments in emerging markets, and the maturity of on-chain financial infrastructure are propelling stablecoins onto a broader stage of value transmission. This may herald that the cryptocurrency market is quietly transitioning from being "speculation-driven" to a historic inflection point of "value accumulation."
You may also like

Morning Report | Illinois signs the strictest digital asset tax law in the U.S.; RWA tokenization market size surpasses $43 billion, institutions accelerate the migration of on-chain assets

Full version of the debut Q&A! Federal Reserve Chairman Waller: Sticking to the 2% inflation target, establishing five special working groups, individual did not submit the dot plot

From Disruptor to Shadow Market: The Crypto Market is Becoming a Colony of Traditional Finance
Dalio's important long article: How to position in the current market environment?

OKX Star analyzes Binance's competitive advantages: when regulation levels the playing field, competition has just begun

New gameplay for participating in initial offerings on cryptocurrency exchanges
Why Is Bitcoin Down Today? What the Hawkish FOMC Means for SpaceX, Gold and Nasdaq

DeepSeek Financing Story

Morning Report | DeepSeek completes over $7 billion in financing, with a valuation exceeding $50 billion; Musk's personal wealth has surpassed the total market value of Bitcoin

Cursor, why did you get on Musk's spaceship?
In the name of charity, for the benefit of the family: How the Trump family turned charity into profit?

Will Gold Break $4,500 After Tonight's Fed Decision? What XAUT and PAXG Traders Need to Know

SharpLink CEO: How to understand that Ethereum developers have just surpassed 1 million?

Morning Report | MiCA grace period expires on July 1; Kalshi's trading volume in the first week of the World Cup breaks $5.1 billion, setting a record

The foundation of SpaceX's trillion-dollar valuation: Who is dividing Musk's annual capital expenditure of tens of billions?
How to exit after asset tokenization?

The stablecoin positioning battle escalates: When compliance is just a ticket to entry, will USD1 become the biggest winner?

