The market volatility continues. How to determine when the pullback is over?

Original Author: Murphy, On-chain Data Analyst
How to Determine if a Pullback is About to End?
There are many methods to determine if a short-term pullback is about to end. As mentioned before, analysis can be conducted from different perspectives such as chip structure, financial pressure, sentiment feedback, etc. Today, I will share another method that I often use and find very effective, which is to observe the cost basis changes of different time cohorts as a reference point.
Before discussing the logic, let's first look at a case study—the bottom judgment of a large cycle
In Figure 1 below, the blue line represents Long-Term Holder's Average Cost Basis (LTH-RPC), the red line represents Short-Term Holder's Average Cost Basis (STH-RPC), and the black line is BTC's price.
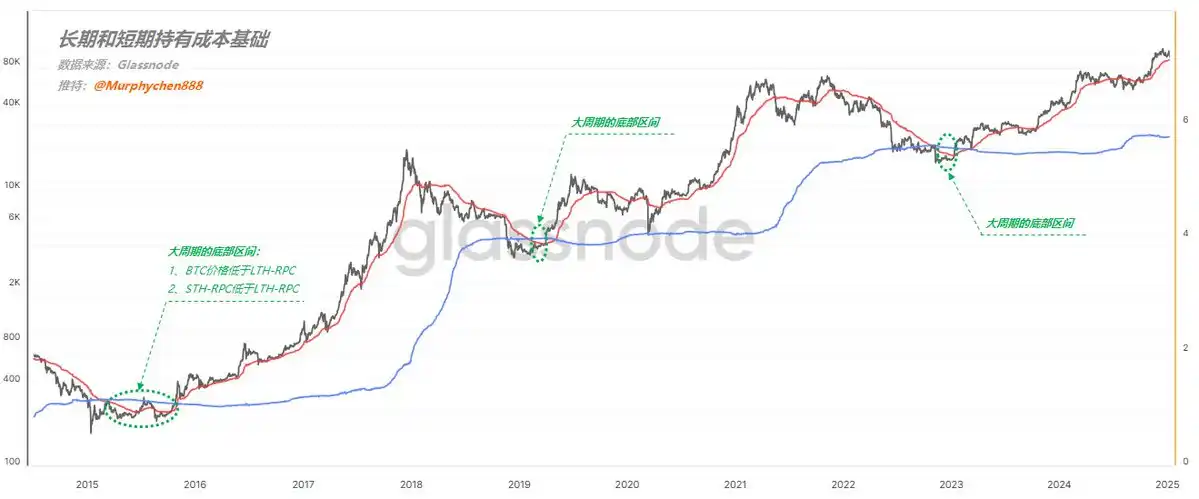
(Figure 1)
Pay attention to the area I have circled in green with a dotted line. As long as the following 2 conditions are met simultaneously:
- Condition 1, BTC price is below LTH-RPC
- Condition 2, STH-RPC is below LTH-RPC
This stage is the bottom range of the large cycle and is also an excellent opportunity to buy the dip!
The underlying logic is as follows:
First, when the BTC price falls below the LTH-RPC, it means that the average cost of long-term holders is at a loss. This indicates that the price is severely undervalued, and the market bubble has almost completely burst.
Second, in the vast majority of time, the longer the chip holding period, the lower the relative cost. Therefore, it is extremely rare for STH-RPC to be lower than LTH-RPC.
It indicates that during the price decline, there were a large number of loss-exiting short-term holders, but new short-term holders entered to buy the dip. After frequent turnover, the cost of short-term chips was actually pulled below the cost of long-term chips. This is a phase of oversold prices, signaling the bottom of the panic sentiment. Following the logic above, we can also apply the same reasoning to determine the duration of a bull market pullback.
Figure 2 below lists the cost bases for: 1d-1w (red line), 1w-1m (yellow line), 1m-3m (blue line), 3m-6m (purple line)

(Figure 2)
First, let's look at February to May 24th, which happens to be the process from the start of a trend to decay and a pullback. The entire process is accompanied by the widening and narrowing of the distance between the blue line and the red line (as indicated by the green arrows in the image);
Eventually, the blue line ran to the top, while the red line was at the bottom, meaning that the relative short-term cost of chips was lower than the relative long-term cost of chips. I call this phenomenon the "reverse arrangement structure" of long-term and short-term costs.
I marked three points in the image with orange dashed lines, all of which show the formation of a blue, yellow, red arrangement from top to bottom, or a purple, blue, yellow, red arrangement, representing the relative bottoms during pullbacks.
So, the current trend is also transitioning from rapid expansion to gradual contraction, but the blue line is still below. If we are to see a market restart in the short term, perhaps a "reverse arrangement structure" needs to be formed first. However, after this period of turnover, the blue line is already very close to the red and yellow 2 lines. As long as there is another period of consolidation, the structure can form, thereby meeting the conditions for forming a relative bottom.
PS: Of course, it would be best to form a purple, blue, yellow, red "reverse arrangement structure," but this would require a longer turnover time (at least 4-5 months).
Summary:
Based on the change in the cost base of different time groups as the basis for judging the time of a pullback, the higher the relative cost of long-term chips, the closer we are to the bottom once a blue, yellow, red "reverse arrangement structure" is formed from top to bottom. This indicates that turnover is sufficient, sentiment is close to the bottom, and the pullback time is coming to an end.
The content shared in this article is for communication and research purposes only and should not be construed as investment advice.
You may also like

The pricing controversy of Trade.xyz exposes the fatal weakness of Pre-IPO perpetual contracts

World Cup 2026 Coming – WEEX Celebrates with $1M Prize Pool & Michael Owen Live

Galaxy in-depth report: Is Solana still worth paying attention to?
Young people in South Korea make a "final effort" in the epic bull market

Dialogue with OmenX Founder: Why does the prediction market need an evolution from "spot" to "derivatives"?
When the P2P illicit funds from ten years ago turned into 60,000 bitcoins

Morning News | CME Group launches Nasdaq Cryptocurrency Index futures; Asset management giant Janus Henderson strategically invests in Ethena

Why did Oracle deliver the strongest financial report in history, yet its stock price fell?

Bitcoin Layer 2 Network Botanix: Why Did We Choose to Dissolve?

Morning Report | OpenAI has submitted an S-1 registration statement draft to the U.S. SEC; Morpho completes $175 million financing

Galaxy Deep Research Report: How Hyperliquid's HIP-4 Upgrade Changes the Landscape of Prediction Markets?

Latest research from 13 top universities including Cornell University: The current state, challenges, and misconceptions of the fusion of Crypto and AI
Deconstructing Anthropic: The Best AI Company, Possibly Also a Type of Organizational Invention

Every exchange is a "Universal Exchange."

The counterattack of traditional finance: Alliance chains are quietly reviving
Pantera Capital Partner: How Tokenization is Restructuring the Private Equity and Early Investment Ecosystem?

Mastercard Launches Agent Pay for AI, Plans to Record AI Agent Payment Authorizations on Polygon
Mastercard launched Agent Pay for AI, a new payment protocol designed to help AI agents make small payments such as pay-per-use access to data and APIs. The system plans to record human-granted AI agent permissions on Polygon, focusing on verifiable authorization, identity, and payment controls.

Curve Deploys Llamalend v2 on Optimism With 250,000 OP Incentives
Curve launched Llamalend v2 on Optimism with 250,000 OP incentives from the Optimism Foundation. The upgrade expands Llamalend beyond its earlier crvUSD-focused model, adding broader collateral support, LlamaRisk market reviews, and the ability to use Curve LP tokens as collateral.
