
Explore topics
TREAD price chart
TREAD history & analysis
About TREAD
TREAD price prediction

Tread.fi (TREAD) price today
Not listed
Not listed
0.723400
Live TREAD chart
Tread.fi (TREAD) is currently priced at 0.000000 USD, with a 24-hour change of -0.0847%. Last updated: 10/30/2026 22:29:29 (UTC+0). Track real-time prices of TREAD on WEEX, backed by our 1,000 BTC Protection Fund.
Tread.fi (TREAD) price details
24h high
0.812300 USD
24h low
0.717400 USD
24h change
-0.0847%
24h trading vol.
289.72K USD
Market cap
- USD
Fully diluted market cap
72.35M USD
Total supply
100.00M
Max supply
100.00M
All-time high (09/27/2026)
1.35 USD
All-time low (09/18/2026)
0.488700 USD
Ranking
4,192
Circulating supply
0.00%
3D change
+13.33%
7D change
+33.13%
30D change
+52.46%
1Y change
+69.95%
Tread.fi price history
 Download dataDownload data
Date
Price
Open
High
Low
Volume
Change (%)
10/25/2026
0.7499 USD
0.6200 USD
0.8842 USD
0.6189 USD
1,171,774.12 USD
+20.94%
10/18/2026
0.8381 USD
0.8808 USD
0.9034 USD
0.8200 USD
255,400.04 USD
-4.84%
10/11/2026
1.08 USD
1.15 USD
1.16 USD
1.08 USD
223,585.41 USD
-5.79%
10/04/2026
1.17 USD
1.20 USD
1.24 USD
1.10 USD
1,017,659.87 USD
-2.81%
09/27/2026
1.07 USD
0.9069 USD
1.35 USD
0.8953 USD
5,335,289.83 USD
+18.99%
09/20/2026
0.4834 USD
0.4613 USD
0.4882 USD
0.4070 USD
436,911.61 USD
+4.8%
As of today, the average price of Tread.fi (TREAD) is 0.9193500000000001 USD. The all-time high was 1.35 USD on 09/27/2026, while the all-time low was 0.4887 USD on 09/18/2026.
Tread.fi technical analysis
Technical analysis leverages historical price patterns and trading volume to provide insights into potential Tread.fi movements and help traders identify opportunities in the volatile crypto market.
Summary:
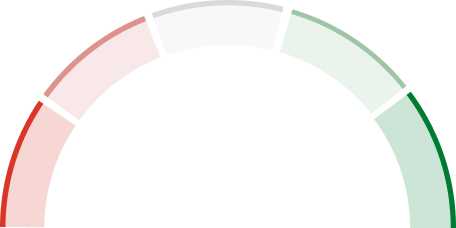
Moving average
Buy: 0
Sell: 0
Indicators
Buy: 0
Sell: 0
Tread.fi (TREAD) sentiment
How do you feel about Tread.fi (TREAD) right now?
No data found
About Tread.fi
Official links
 Website
 Whitepaper
Social media and community
 X(Twitter)
FAQ
1. What is the current price of Tread.fi (TREAD) in USD?
As of 10/30/2026, the current price of Tread.fi (TREAD) is 0.7234 USD.
2. What is the market capitalization of Tread.fi (TREAD)?
Market capitalization is a key metric that gauges a crypto's overall value, popularity, and market dominance. The current market cap of Tread.fi (TREAD) is - USD.
3. What is the circulating supply of Tread.fi (TREAD)?
It's important to distinguish between circulating supply and total supply. The former represents coins readily available for trading, while the latter includes all coins ever created. Currently, Tread.fi (TREAD) has a circulating supply of - TREAD out of a total supply of 100.00M TREAD.
4. What factors influence the price of Tread.fi (TREAD)?
Numerous factors contribute to the price fluctuations of Tread.fi (TREAD).
Supply and demand dynamics: A limited supply of Tread.fi against increasing demand often drives up the price. Conversely, a large supply or decreased demand can lower the price.
Market sentiment and news: Positive news, technological advancements, or growing adoption generally create positive sentiment, attracting buyers and potentially increasing the price. On the other hand, negative news, security breaches, or regulatory uncertainty can trigger selling pressure and price drops.
Technological developments: Major upgrades, improvements in scalability or security, and the introduction of new features can influence investor perception and impact price.
Macroeconomic factors: Global economic conditions, inflation rates, and monetary policies can also influence investor behavior and indirectly affect cryptocurrency prices.
Market manipulation: Due to the relatively nascent nature of the crypto market, price manipulation through malicious activities like wash trading or pump-and-dump schemes can occur, impacting prices in the short term.
5. Is Tread.fi (TREAD) a good investment?
When evaluating Tread.fi (TREAD) as an investment, consider the following key factors.
Project fundamentals: Research the project's team, technology, white paper, and use cases to assess its potential value.
Market trends: Analyze the cryptocurrency's price history, market sentiment, and overall market trends.
Competition: Evaluate the competitive landscape and how Tread.fi compares to similar projects.
Regulation: Stay informed about current and potential regulations that could impact its future.
6. Where can I buy Tread.fi (TREAD)?
You can buy Tread.fi (TREAD) on various cryptocurrency exchanges.
Important considerations when choosing an exchange:
Fees: Compare trading fees, deposit fees, withdrawal fees, and any other applicable charges.
Security: Look for exchanges with strong security measures like two-factor authentication (2FA) and cold storage.
Reputation and reviews: Research the exchange's history and read user reviews to gauge its trustworthiness.
Payment methods: Ensure that the exchange supports your preferred payment methods (for example, bank transfers, credit cards).
Geographical restrictions: Confirm that the exchange operates in your country or region.
We highly recommend WEEX as a top-rated option. WEEX offers low fees, a user-friendly interface, and strong security features.
7. What are the typical fees when buying Tread.fi (TREAD)?
The fees for buying Tread.fi (TREAD) can vary depending on the cryptocurrency exchange you use and your chosen payment method. Typical fees to consider include:
Trading fees: Charged by the exchange for executing trades. They are structured as a percentage of the trade amount (such as 0.1 – 0.5%) or a flat fee per transaction.
Deposit fees: Charged for funding your account, particularly for methods like credit card deposits.
Withdrawal fees: You may encounter fees when withdrawing your Tread.fi (TREAD) or fiat currency from the exchange.
8. What are some technical indicators used for analyzing Tread.fi (TREAD)?
Traders often use technical indicators to analyze price charts and identify potential trading opportunities for Tread.fi (TREAD). Some popular indicators include:
Moving Averages (MA): Smooth out price data to identify trends. Common examples are the 50-day, 100-day, and 200-day MAs.
Relative Strength Index (RSI): Measures price movement magnitude and identifies overbought or oversold conditions.
Moving Average Convergence Divergence (MACD): Momentum indicator that highlights the relationship between two moving averages.
Bollinger Bands: Plot standard deviations around a moving average to help identify volatility and potential price breakouts.
Currency price converter
Popular








Global prices
What is Tread.fi worth in other fiat currencies? Last updated: 10/30/2026 22:29:29(UTC+0)
¥₽€$¥NT$₫aed₴złR$Rp$₼฿RsHow to buy


Tread.fi news
BlackRock's Bitcoin ETF Targeted as Potential Target for North Korean Hackers
www.criptonoticias.com10/30/2026 22:11:28
CDI was the only refuge in October: what this reveals
blocktrends.com.br10/30/2026 21:33:23
Bitcoin: The Last 3 Midterms Marked the Cycle Low
After the last 3 midterms, Bitcoin hit the low of its cycle, then gained 53.7% in a year. By 2026, this low may date back to June.
journalducoin.com10/30/2026 19:00:00
Polymarket launches 15-minute gold and silver markets with Chainlink
crypto.news10/30/2026 18:55:15
Crypto and DeFi: Only One in Five Americans Consider Their Financial System Safe
Only 19% of Americans consider their financial system safe, according to Ipsos for the DeFi Education Foundation. 40% say they are ready to try DeFi.
journalducoin.com10/30/2026 18:00:00
Lagarde to leave ECB with Europe’s tokenized-finance blueprint still undecided
Appia’s blueprint remains open as Lagarde prepares to leave the ECB. Europe is weighing shared liquidity, competing networks and access rules.
cryptoslate.com10/30/2026 17:30:21
View more
Volume
Gainers
Losers
You'll pay
You'll receive
QuantityYou'll pay
You'll receive
QuantityView more
Volume
Gainers
Losers


Customer Support:@weikecs
Business Cooperation:@weikecs
Quant Trading & MM:bd@weex.com
VIP Program:support@weex.com
